
What do wheat flour (purple), icing sugar (green), and cornstarch (blue), three fairly similar-looking white powders, look like in spectroscopy ?
A few things that help to differentiate them:
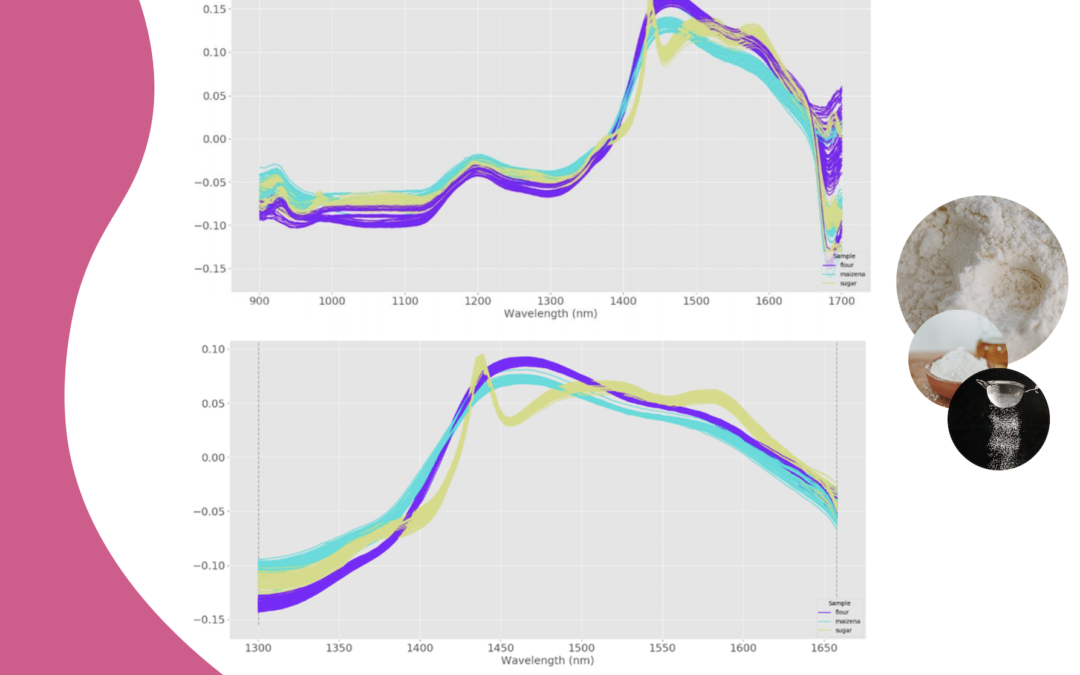
Note that there is no major distinction between the spectra corresponding to the three samples before the 1300nm wavelength, except for a peak in the spectra acquired for the powdered sugar (greens) at 990nm, probably due to the presence of phenol (or carbolic acid), an aromatic compound.
The spectra of flour (purple) and cornstarch (blue) are particularly similar, this can be explained by the “cereal” origin of the two types of samples – we note however a greater absorption between 1400 and 1650nm of flour, which can be explained by its higher protein content.
Spectral analysis allows applications for detection, identification, quantification of samples of all kinds.
🏳️ Figure 1: Spectra of flour, powdered sugar and maizena, NIR (near infrared) spectroscopy. The results in this figure have been pre-processed using an average reduction for better visualization.
🏳️ Figure 2: Spectra of flour, powdered sugar and maizena, NIR (near infrared) spectroscopy. The results in this figure have been pre-processed using a mean reduction for better visualization, and reduced to 1300-1660 nm.